
Recommended

Python Forex Candlestick Chart Animated.
Create live candlestick chart from tick data
Jupyter setup for live charting.
###### You need this to animate the matplotlib chart inside jupyter environment, otherwise just skip this step.
%matplotlib inline
%load_ext autoreload
%autoreload 2
%matplotlib notebook
Donwload tick data
We will use duka library to download tick data for us. If you do not have duka installed, just use ‘pip install duka’
import duka.app.app as import_ticks_method
from duka.core.utils import TimeFrame
import datetime

start_date = datetime.date(2019,1,1)
end_date = datetime.date(2019,2,1)
Assets = ["EURUSD"]

import_ticks_method(Assets,
                    start_date,
                    end_date,
                    1,
                    TimeFrame.TICK,
                    ".",
                    True)
[####################################################################################################] 100% Left : 0:00:00
Load the file to pandas dataframe
import pandas as pd

tick_data = pd.read_csv("EURUSD-2019_01_01-2019_02_01.csv",
                        index_col=["time"],
                        usecols=["time", "ask", "bid"],
                        parse_dates=["time"])
tick_data.head()
| ask | bid | |
|---|---|---|
| time | ||
| 2019-01-01 22:02:37.254 | 1.14682 | 1.14598 |
| 2019-01-01 22:02:38.590 | 1.14682 | 1.14599 |
| 2019-01-01 22:02:39.138 | 1.14684 | 1.14599 |
| 2019-01-01 22:02:55.787 | 1.14684 | 1.14598 |
| 2019-01-01 22:03:02.060 | 1.14684 | 1.14598 |
Convert tick data to OHLC candlestick data
We will wrap this conversion inside a method and call it.
def convert_ticks_to_ohlc(df, df_column, timeframe):
    data_frame = df[df_column].resample(timeframe).ohlc()
    return data_frame

data_ask = convert_ticks_to_ohlc(tick_data,"ask","240Min")
data_ask.head()
| open | high | low | close | |
|---|---|---|---|---|
| time | ||||
| 2019-01-01 20:00:00 | 1.14682 | 1.14691 | 1.14611 | 1.14616 |
| 2019-01-02 00:00:00 | 1.14616 | 1.14630 | 1.14431 | 1.14460 |
| 2019-01-02 04:00:00 | 1.14462 | 1.14971 | 1.14430 | 1.14768 |
| 2019-01-02 08:00:00 | 1.14757 | 1.14784 | 1.14224 | 1.14341 |
| 2019-01-02 12:00:00 | 1.14341 | 1.14343 | 1.13421 | 1.13538 |
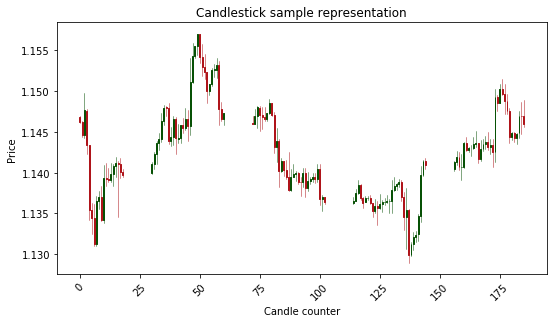
Create candlestick chart
We will use matplotlib finance library called as mpl_finance in order to generate our candlestick chart.
from mpl_finance import candlestick_ohlc
import matplotlib.pyplot as plt
import matplotlib.ticker as mticker

fig = plt.figure(figsize=(8,5))
ax1 = plt.subplot2grid((1,1), (0,0))

candle_counter = range(len(data_ask["open"])-1)
ohlc = []
for candle in candle_counter:
    append_me = candle_counter[candle], \
        data_ask["open"][candle], \
        data_ask["high"][candle],  \
        data_ask["low"][candle], \
        data_ask["close"][candle]
    ohlc.append(append_me)

candlestick_ohlc(ax1, ohlc, width=0.4, colorup='#075105', colordown='#AF141A')
for label in ax1.xaxis.get_ticklabels():
    label.set_rotation(45)
ax1.xaxis.set_major_locator(mticker.MaxNLocator(10))
ax1.grid(True)
plt.xlabel('Candle counter')
plt.ylabel('Price')
plt.title('Candlestick sample representation')
plt.grid(False)

plt.subplots_adjust(left=0.09, bottom=0.20, right=0.94, top=0.90, wspace=0.2, hspace=0)
plt.show()
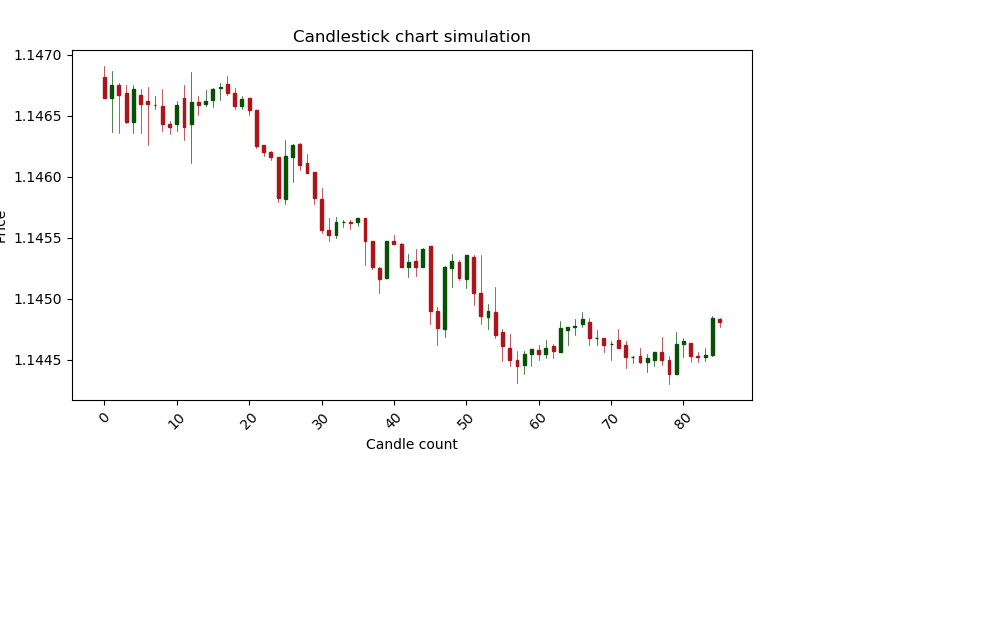
Create live candlestick chart
Now we will use above method and make the chart animated by adding new candles and removing old ones.
# - Thise is needed in order to work inside jupyter notebook.
%matplotlib notebook

# - Imports
from mpl_finance import candlestick_ohlc
import matplotlib.pyplot as plt
import matplotlib.ticker as mticker
import time

# - Load tick data to pandas dataframe
tick_data = pd.read_csv("EURUSD-2019_01_01-2019_02_01.csv",
                        index_col=["time"],
                        usecols=["time", "ask", "bid"],
                        parse_dates=["time"])

# - Convert tick data to ohlc format
candlestick_data = convert_ticks_to_ohlc(tick_data,
                                         "ask",
                                         "5Min")

# - Initialise the graph and settings
fig = plt.figure(figsize=(8,5))
ax = plt.subplot2grid((1,1), (0,0))
plt.ion()

# - Show the blank graph
fig.show()
fig.canvas.draw()

# - Iterate through candles and add them to chart
all_candles = range(len(candlestick_data))
for candle in all_candles:
    candles_to_show = candlestick_data[0:candle]
    ohlc_counter = range(len(candles_to_show["open"]))
    ohlc = []
    for ohlc_item in ohlc_counter:
        append_me = ohlc_counter[ohlc_item], \
                    candles_to_show["open"][ohlc_item], \
                    candles_to_show["high"][ohlc_item],  \
                    candles_to_show["low"][ohlc_item], \
                    candles_to_show["close"][ohlc_item]
        ohlc.append(append_me)
    ax.clear() # - Clear the chart
    candlestick_ohlc(ax, ohlc, width=0.4,
                     colorup='#075105',
                     colordown='#AF141A')
    for label in ax.xaxis.get_ticklabels():
        label.set_rotation(45)
    ax.xaxis.set_major_locator(mticker.MaxNLocator(10))
    ax.grid(True)
    plt.grid(False)
    plt.xlabel('Candle count')
    plt.ylabel('Price')
    plt.title('Candlestick chart simulation')
    plt.subplots_adjust(left=0.09, bottom=0.20, right=0.94,
                        top=0.90, wspace=0.2, hspace=0)
    fig.canvas.draw() # - Draw on the chart
    time.sleep(0.1) # - Wait 0.1 sec between each candle
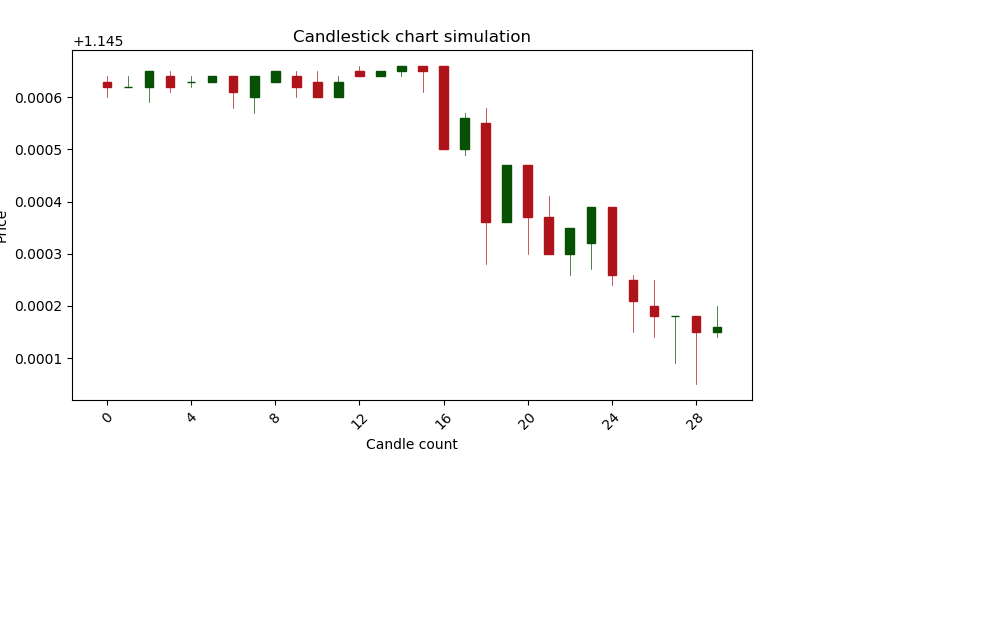
Wrap it all in a class instance
%matplotlib notebook
from mpl_finance import candlestick_ohlc
import matplotlib.pyplot as plt
import matplotlib.ticker as mticker
import time

class LiveChartEnv:
    def __init__(self, tick_data, time_frame,
                 candle_window, wait = 0.01):
        self.tick_data = tick_data
        self.time_frame = time_frame
        self.candle_window = candle_window
        self.wait = wait
        print('Class initialized succesfully')

    def initialize_chart(self):
        self.fig = plt.figure(figsize=(8,5))
        self.ax = plt.subplot2grid((1,1), (0,0))
        plt.ion()
        self.fig.show()
        self.fig.canvas.draw()

    def update_chart(self, candle_data):
            candle_counter = range(len(candle_data["open"]))
            ohlc = []
            for candle in candle_counter:
                append_me = candle_counter[candle], \
                            candle_data["open"][candle], \
                            candle_data["high"][candle],  \
                            candle_data["low"][candle], \
                            candle_data["close"][candle]
                ohlc.append(append_me)
            self.ax.clear() # - Clear the chart
            candlestick_ohlc(self.ax, ohlc, width=0.4,
                             colorup='#075105',
                             colordown='#AF141A')
            for label in self.ax.xaxis.get_ticklabels():
                label.set_rotation(45)
            self.ax.xaxis.set_major_locator(mticker.MaxNLocator(10))
            self.ax.grid(True)
            plt.grid(False)
            plt.xlabel('Candle count')
            plt.ylabel('Price')
            plt.title('Candlestick chart simulation')
            plt.subplots_adjust(left=0.09, bottom=0.20, right=0.94,
                                top=0.90, wspace=0.2, hspace=0)
            self.fig.canvas.draw() # - Draw on the chart

    def convert_ticks_to_ohlc(df, df_column, timeframe):
        data_ohlc = df[df_column].resample(timeframe).ohlc()
        return data_ohlc

    def candlestick_simulation(self):
        candlestick_data = convert_ticks_to_ohlc(self.tick_data,
                                                 "ask",
                                                 self.time_frame)
        all_candles = len(candlestick_data)
        self.initialize_chart()
        for candle in range((all_candles - self.candle_window)):
            candles_to_show = candlestick_data[candle:(candle+self.candle_window)]
            self.update_chart(candles_to_show)
            time.sleep(self.wait)    #sleep
Use LiveChartEnv class to animate chart
Load tick data to dataframe
tick_data = pd.read_csv("EURUSD-2019_01_01-2019_02_01.csv",
                        index_col=["time"],
                        usecols=["time", "ask", "bid"],
                        parse_dates=["time"])
tick_data.head()
| ask | bid | |
|---|---|---|
| time | ||
| 2019-01-01 22:02:37.254 | 1.14682 | 1.14598 |
| 2019-01-01 22:02:38.590 | 1.14682 | 1.14599 |
| 2019-01-01 22:02:39.138 | 1.14684 | 1.14599 |
| 2019-01-01 22:02:55.787 | 1.14684 | 1.14598 |
| 2019-01-01 22:03:02.060 | 1.14684 | 1.14598 |
Create class instance of candlestick environment
candlestick_chart = LiveChartEnv(tick_data, "1min", 30)
Class initialized succesfully
Simulate chart with only candles
candlestick_chart.candlestick_simulation()
Youtube tutorial: